That Was The Week Non Farms Were a Non Event
Wall Street traders think good news is bad news- it may be when you are so desperately leveraged, that an increase in interest rates can be catastrophic. The job numbers on Friday from the US were very good https://www.forexfactory.com/calendar 263k jobs added, apparently. This gave a green light to further interest rate rises. Punchbowl addicts gave a shudder. Interest rate rises mean little to us, though we factor in Rho in our options calculations. Rises are incemental and miniscule on an individual basis. Who cares if it’s a 0.5% or 0.75% rise? Our margin is cash and works for us while attracting no interest whatsoever. Capital employed is better than capital at rest.
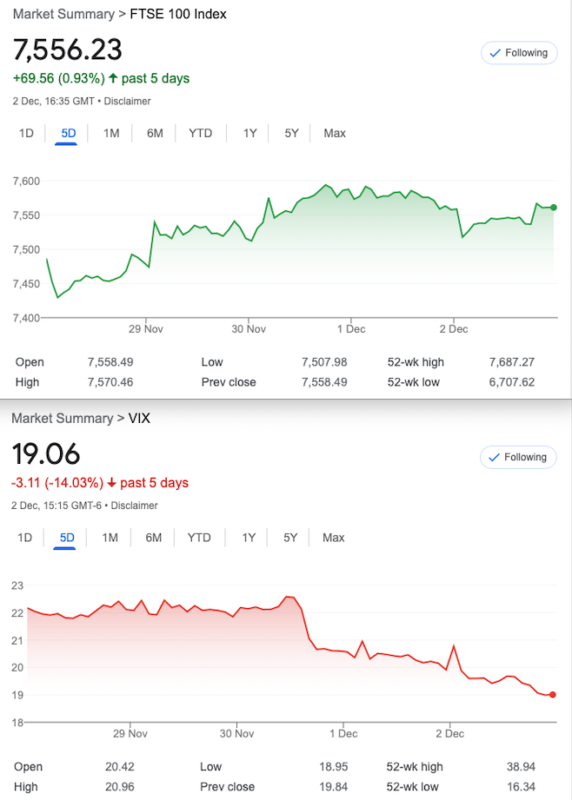
Meanwhile a couple of graphics to ponder. 
And with a weather eye on Sterling’s massive rise:
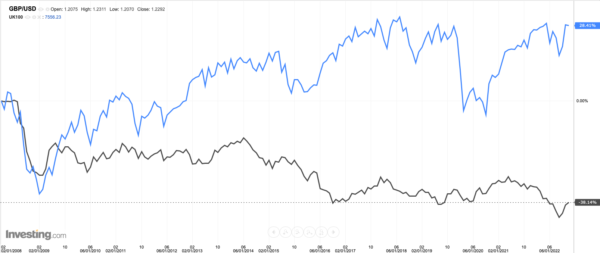
Two charts to mull over for entertainment purposes. Is VIX so predictive? Is £ sterling’s strength/US dollar a precursor to a FTSE drop?
I used to follow the doom mongers and my own mindset is always slanted to the downside. Overpriced rubbish can remain so for a very long time. Ultimately the market is a collection of opinions, armed with mountains of other people’s money. However I may do a great disservice to all those who worked so hard to get their validation. We need the market, and are eternally grateful for their efforts.
Other Business:
Last week I posted a link to theice.com which explained the FTSE options chain, but did not give any clue as to where to get prices. This is the correct link to get all the options prices, but it may default to FTSE. https://www.theice.com/marketdata/reports/265
For calculations I use: https://www.cmegroup.com/tools-information/quikstrike/options-calculator.html?utm_source=LINKEDIN_COMPANY
ANY questions- fire us an email at surreyhantstraders@gmail.com – that really means ANY questions.
Distraction Trades -( We may seek other adventures)
ADA $0.3230 Crypto’s hanging in there but who knows where they are going.
XRP $0.39382
DAX 1 win 80 2 no entries 1 break even (+30) 1 loss(-30) Trading should be boring but this is duller than one might desire. Yes it makes a profit, but entries are not infallible.
Trade 293 Dec Expiry, 294 something especially dumb- a 3 by 1
Pity we could not find a nice calendar trade to give us some long options but we have a clean sheet.
We can be long and short here with a call ratio spread for a ha’penny. We buy the Dec 7500 call for 58.5 and sell 2 of the 7600 calls for 29(x2)= 58
In anticipation of the Santa rally -we could make the max 100 with FTSE at 7600, we have risk at 7700. We have NO downside risk
Was 88 and 42.5 x2, gives us a credit of 3 this week 113, for the 7500 and for the 7600, 53×2= 7 let’s not get carried away.
Trade 294 These Animals Keep Buying the FTSE!
OK so it seems there’s a battle at the top around 7500 and while our call position makes ££££ around there, if it drops, it’d be nice to cover that event too. We need to own some puts. Let’s buy a 7500 put and find a way to pay for it. Let’s go high risk and sell 3 puts to buy one. We will sell the 7250 strike put x3. So we have to pay 88 for the 7500 put and we collect 25.5×3. Our debit therefore is 11.5 with max profit 250. Where’s our risk?
Can you see at 7250 we make 250, but at 7150 the short puts are worth 300 against our now, 350. So we need to ‘get out of Dodge’ if this market gets bearish big time. Break even then is at 7125 So in combination we have these risks: for trade 293 at 7700, and 7125 from trade 294 with potentially big gains in between.
Those prices now: 7500 put= 43 and 7250s= 10.5×3 = 11.5 -watch this fly!
Trade 295 December, Santa rally yadda yadda
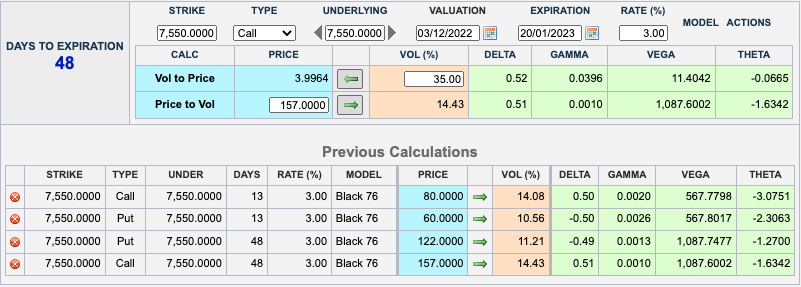
Regulars will know we have done ratio calendar straddles a few times but never with much success. Rather than keep such a pristine record sheet of wins, sometimes it’s good to see the warts an’ all moves. We buy 2 of the current month straddles( 7550 put AND call) and SELL the same straddle in January.
Those prices for Dec 7550 call and put 80 and 60 for January: 157 and 122. So 140 x2, and 279 so we pay a penny.
The logic of this is that a sharp move would be of greater benefit to the short term volatility, and therefore any price increases in the near month would be relatively greater than those January prices. Here’s the calculator https://www.cmegroup.com/tools-information/quikstrike/options-calculator.html?utm_source=LINKEDIN_COMPANY
And for fun, check out the gamma and vega -but be aware of the brutal theta. There’s not a lot of hope but it’s fun. Let’s also explore the possibility of doing the reverse trade too.
Remember: If you have any questions about the trades here, please email us at: surreyhantstraders@gmail.com