 FTSE Going Who Knows Where?
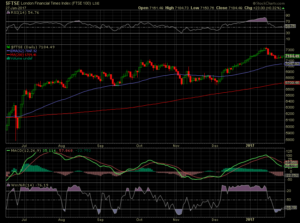
Each W/end I construct my charts from http://stockcharts.com/freecharts/marketsummary.html?E The choices of technicals and style are terrific. And it’s free. That does not devalue its worth however, as charts are just graphical representations of dry numbers, it’s no version of numbers. No ‘alternative facts’. The problem is how to interpret and does it help in deciding where to put our trades?
Down is the new Up
Seems to me while a number of factors have contributed, the FTSE has gone bonkers. Yes, the UK deficit is now 2% of GDP, yes we have ‘growth’ around 2%. Allegedly. But as a contrarian I like the idea of cheap downside trades. Volatility means selling more options than we own is probably not a great idea, until we see vol. tick up meaningfully. My choice of trade and it only has 3 weeks to go would be to buy a cheap put spread. Buy the 6950put -debit 20,and sell the 6900put credit 15 overall cost=5.
Not a Great Trade but We are Scratching Around
To be honest I’m almost 100% on the sidelines currently as the pickings are too slim. It’s not a bad time to look for a juicy down move, but with modest costs. The chart shows the 200 moving average around 6700. Is that a likely level in the next 3 weeks? Probably not, and I think there may be another attempt at 7350. However we are not here to grandstand, we are here to illuminate. Should the trade look hideous in a week or so,we’ll make another plan. Trades to date however would mean that tiny dents in the trading account are acceptable
The Most Money I made Was from….
Sitting on my hands. This is a quote from a well know options guru. It’s often true that by doing nothing and waiting for the market to come to you, profits will be greater.
Stockcharts is a great resource and J Murphy wrote the book on TA. It is worth taking some time to look at technical analysis, or charting- it may not be for you,but you may find your niche. Either way there are people who make serious money from charts, and in trading we need to find our own way, often ruling out that which doesn’t suit.
The trade this week is a bit boring but in my defence I am still unwell,and cannot honestly see ‘what the heck is going on until our people figure this out’. To quote!
In the past I believe the charts will show that twice a year the market dips by 4-6%. You may wish to construct a strategy around this sortof thing- I have not done it but I know there are times when put prices go to the Moon. You can multiply your money buying put strategies in times of market peaks and low volatility. I’m not a great trader but I’d bet there are many who sit on the sidelines until conditions line up for a big fat drop.
today that trade hit 8 – a 60% profit but if this had been in size with low commissions you’d take that all day long.