That Was The Week War On War Off
So just as the week was coming to the end Iran and the US decided to have another go. The US administration is under fire from every legal direction. Executive powers are being reined in, sacked high ranking military personnel are not going without a fight. The Epstein Files came a step closer to scrutiny. Epic amounts of law ‘bending’ now in trouble in unbiased courts. Factoring in the crazy stuff is impossible, but it’s folly to ignore as the market turns in a moment. So that’s the political slot. Oh, wait, we no longer have prime minister. It’s so dull it barely merits media attention.
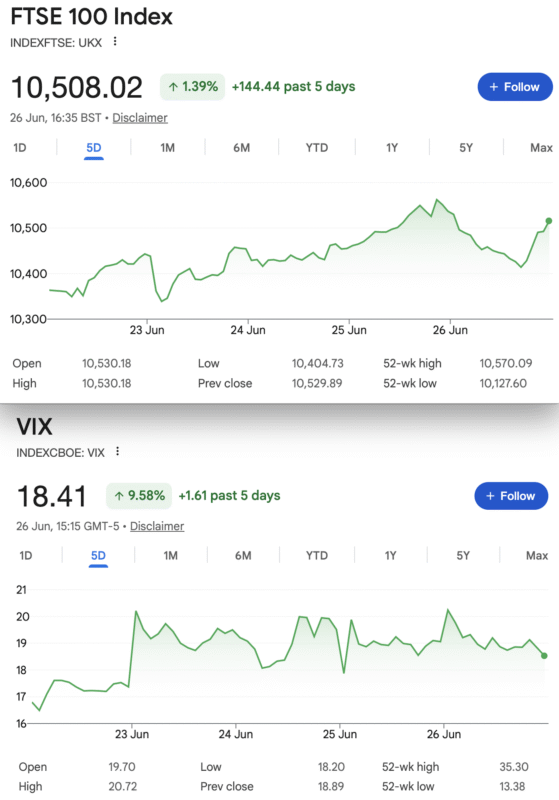
It was with some relief the market took a dip below the key level of 10400, but then you know who came steaming in with large wads of cash. ‘Buy the f***in’ dip’ is never far from the sidelines. Put sellers have another marathon as overvaluation becomes meaningless. Ironic that Silver and Gold have sold off, for no good reason, but it shows the power of the big money. We are minnows in a large pond.
What Really Helps In Trading?
I was recently in a meeting discussing the veritable cornucopia of data providers and how best to use them. Personally I see market data as the equivalent of a car’s MOT( annual roadworthy test in the UK for cars over 3yrs old). At the time of the MOT the vehicle is fine but does it predict absence of faults for the ensuing 12 months? The certificate, like data is of the moment and next week the engine can explode, the data can be rendered useless. Current times are testimony to that, but data is not much use in isolation. P/E ratios are helpful when you get an idea of cheap/expensive, and yet Tesla in on a p/e of 340. I.E. it would take 340 years to get your money back. Does that sound like a bargain? Other data like VIX is valuable, but only in context.
It’s worth knowing how VIX is derived and how it can be used https://en.wikipedia.org/wiki/VIX As it’s based on actual options prices it tells us where we’ve been and based on probability where we may be headed. This week shows VIX up 10%which may be the market having a few anxiety attacks. Perhaps gauging the mood is what we can derive from data, rather than hard numbers. I remain cynical and that’s not helpful, but I have much experience that tells me options traders are smarter. Smart does not always mean successful, however!
In The Inbox
Who’d have thunk it? CBOE video on ….. volatility https://cboe-1.wistia.com/medias/b0pu6suh9o?wvideo=b0pu6suh9o&wemail=davideppel1%40aim.com
Always an excellent resource which as always makes our dearth of data providers apparent. We have nothing like this in th UK but the principles remain constant.
Our tiny island under scrutiny: https://www.cnbc.com/video/2026/06/22/new-uk-pm-must-maintain-financial-market-credibility-goldman-sachs.html?lid=nddd0ctaq4cu&chl=em&cid=2026-06-26&plt=briefings
CME giving us insights again. https://view.the.cmegroup.com/?vawpToken=T2WHVESP25DEDHQ4OSFRQ2SSWM.110063
Distraction Trades
ADA was $0.1624 now $0.1469
XRP was $1.1459 $1.0571 Crypto has not been convincing lately. I like this source https://coinmarketcap.com
DAX : Under review after poor record lately However, a new method produced 2 trades nett 300
UK Gilts Were £ 15.64 now £15.78 This is based on the Vanguard ETF. Not the worst outlook, yields in the short term may be worth a look, currently 4.78%
Silver: Using Wisdom Tree Physical Silver(PHAG) Went long at $71.31 and now $53.95 After the massive 10% rise it crashed back down and hence my entry. Do not follow me this is not a huge position and luckily I have done well this year with Ag. A big ouch! Again this week.
Legacy Trades and New Trade 472
Trade 424 High Roller, This is a Trade Gone Wrong
PRECIS: We started from a July 2025 losing trade as below. Short calls are rarely a good idea.This is a ratio spread 8450/8650 calls
In summary we have an old trade from July 2025 which is a loss of 1741 against the credits taken in, of 422
Was 1539 big yawn but that’s the point. This will run until it’s no longer in a loss.
then 1912, 1712.5(x2) gives us 1513
then 1771 1571.5×2 = 1372
Crazy time, as our strike( 8450) does not exist for June so we roll from 1914,1714=1514, to the new strikes up 50, 8500/8700: 1875.5,1678 =1480.5.
Our new position therefore is 1480.5 underwater and we have a debit of 33.5 So the running income is now 422-33.5= 388.5
Previously 1984,1786= 1588 underwater
Last, 1939.5, 1740.5= 1541.5 ( Currently rolling to July would give 1579.5 )
Last week: 1,884.5, 1,685×2 = 1,486 ( possible roll to July 1507.5 )
Was : 8500 1963.5, 8700 1764 x2= 1643 Looks like a roll might cost money
So, cost 1606.5 to close, buy to open for July 1640. A credit 33.5 ( Running income 422 )
8500 2035.5, 8700 1836.5(x2) gives us –1637.5
Trade 471 A New Month -Seasonality?
Ask AI- https://www.ecosia.org/ai-chat?q=july+stock+market+performance
It seems when July takes a dump it’s of Elephantine proportions! But typically it’s an up month. Should we pay much attention to the past?
I like to think there’s a disaster around every corner, like all good dramas! Let’s buy a cheap handsome looking put spread and pay for it by selling a put further out. Those strikes and prices: buy the 10100 put, 45, sell the 10000 put 32.5 and sell the 9700 put for 14. Gives us a tiny credit 1.5. Most likely it will go to nothing and we lose nothing. But… it can make 100
This week: 10100 23, 10000 17, 9700 8.5, negative 2.5 Now we can do another lot, what’s the problem with that?
Trade 472 The Trade A.I. Hates
https://www.cmegroup.com/tools-information/quikstrike/options-calculator.html
The above link takes you to the calculator like this: 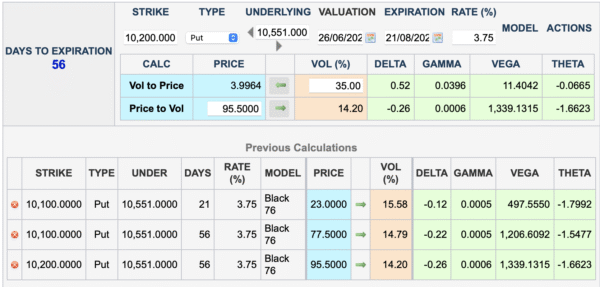
Put sellers have had it their own way as the dup buyers seem to have bottomless pockets, so let’s have some put risk. We are selling the July 10100 put, we are selling the August 10100 put and buying the August 10200 put. It’s a calendar spread but our far month has an extra short put. Let’s do the maths: Delta over all is +0.34 – 28= +0.08 almost neutral. Gamma almost neutral, Vega -near month more spicy as expected, but here’s Theta: 1.68 in our favour. Risk around 10000.
However let’s run a parallel trade- the diagonal which is low risk but you can lose a fair chunk of premium. A diagonal is: sell an option in the near month, buy one of a different strike in the next month, so here(10100 July, 10200 Aug) it costs 95.5-23= 72.5. Some people trade these very successfully but for me you are chasing the market for your money back. We’ll run both and collect £££ or adjust
Glossary:
There are two types of options: Puts, give you the right but not the obligation to sell the underlying asset . Calls give you the right, but not the obligation to buy the underlying asset.
When you sell those options, the opposite happens, with puts you get stock ‘put‘ to you at an unfavourable price (or not) and calls you get the stock you own taken, or ‘called’ away. If you don’t own the stock you need to stump up the cash, but in both cases with the FTSE index they are cash settled at £10 a point, so losses and gains are uncomplicated.
Please read the links below for a more comprehensive explanation in simple terms. Options are about mindset, only a modicum of intelligence required.(I’m living proof)
For those new to options:
https://optionsinvesting.co.uk/special-edition-how-options-work-1/
https://optionsinvesting.co.uk/special-edition-how-options-work-2/
https://optionsinvesting.co.uk/how-options-work-page-3/
Contact: surreyhantstraders@gmail.com.
If there is anything you’d like help with, we all started somewhere and yes, it can be baffling. There are no stupid questions, give it a whirl. (AI gets things wrong, remember)
All opinions expressed here are not to be taken too seriously and all of the trades are for educational purposes only.