
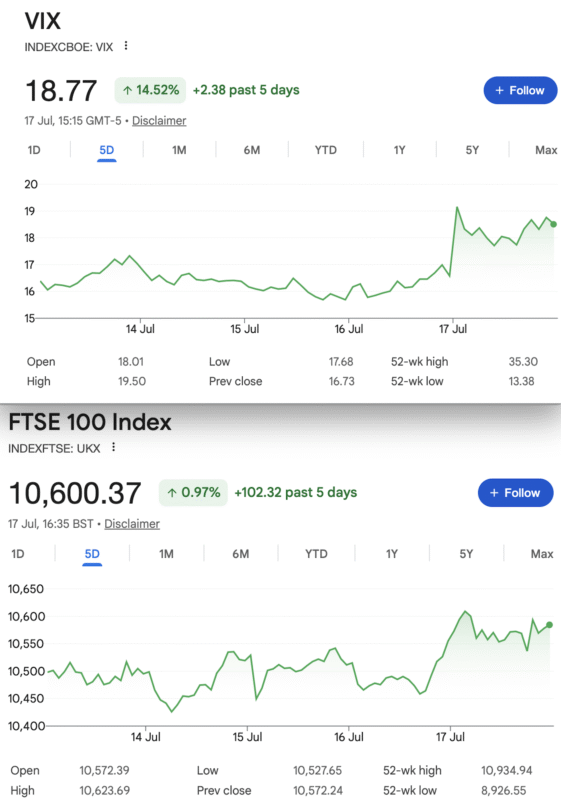
That Was The Week We Perspired, Options Expired
The office of the most powerful position in the World should be dignified and quiet. Exuding an air of confident measured power. It’s not, it’s a nasty pantomime that is impossible to ignore. Mainly because the betrayal of everything decent is great for the media. Except, this time, the serious channels refused to air the appalling lies. Absent the oxygen of publicity and he becomes more unhinged. Sadly this is the world we have to navigate as best we can. I believe we trade with a mindset that is always a few weeks behind. Now it’s a jumble sale, and we need to have strategies that are robust. Simply buying and holding stocks, the ‘idiot trade’ has flourished in patches. We have 3 wins, 2 losers* this month.
Would you buy a company’s stock if it was trading at a P/E of 340? And that is with earnings that had massive boost from the taxpayer. https://subsidytracker.goodjobsfirst.org/parent/tesla-inc And the EV $7,500 subsidy has gone, and that’s another story. With so much uncertainty increasing daily as legal cases stack up like the Himalayas against the Trump regime you have to think there’s going to be a massive fallout. Markets can remain irrational longer than we can stay solvent. So……
*Arguably we did not suggest the strategy as the reverse was worth consideration (OK it was a suicide trade)
How Did We Get To This?
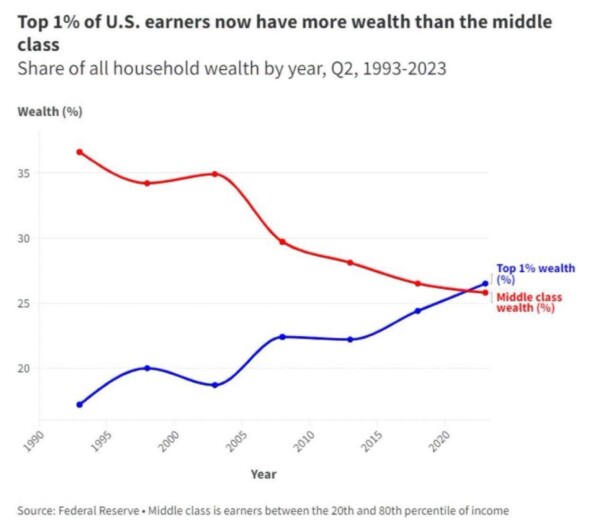
With a lot of talk about a wealth tax and the burgeoning inequality the chart is a shocker, because it’s happened so fast. In the early 90s Apple was a struggling computer company that also made wacky devices.Food for thought. The chart suggests things are really going to accelerate as the middle-class find AI is taking their jobs, while tax avoidance methods for the uber rich become ever more robust and varied. Theirs are the pockets we cannot pick. Anyone not troubled by this?
So to look after our tiny investing warchest it’s important to have a healthy portion of options. We control the timeline, the area of risk, multiples and direction, or non-direction. The upward trajectory of stock markets can suddenly become a rout. Stopped clock trading however is not a plan, simply expecting the rout and buying a shedload of puts. However it has worked for some people. There’s a film about it.
In The Inbox
This from our Australian cousin: https://thepatientinvestor.com/index.php/2026/07/18/us-asx-leading-indicators/
I get regular emails from this group but if anyone goes ahead with subscription please let us know https://doriantrader.com/welcome-new-meetup-members/
This site is the product of a fledgling options Meetup from long ago. ANY options education is worth having, it’s never your average ‘trading academy’ nonsense or get-rich-quick scheme.
Distraction Trades
ADA was $0.1678now $0.1660
XRP was $1.1089 now $1.0879 Crypto has not been convincing lately. I like this source https://coinmarketcap.com
DAX : Under review after poor record lately However, the new method produced 2 wins nett 450 Not convinced yet.
UK Gilts Were £15.63 Ouch! £15.51. This is based on the Vanguard ETF. (VGOV) Not the worst outlook, yields in the short term may be worth a look, currently 4.78%
Silver: Using Wisdom Tree Physical Silver(PHAG) Closed out for $55.46 last week now $50.78. After the massive 10% rise it crashed back down and hence my previous entries. Do not follow me but if you have to own silver, this ETF is backed by Physical. I’m now neutral to negative, but I made a few £££ on the way
Legacy Trades, Expiry and New Trade 475
Trade 424 High Roller, This is a Trade Gone Wrong
PRECIS: We started from a July 2025 losing trade as below. Short calls are rarely a good idea.This was a ratio spread 8450/8650 calls
In summary we have an old trade from July 2025 which is a loss of 1741 against the credits taken in, of 422
So, cost 1606.5 to close, buy to open for July 1640. A credit 33.5 ( Running income 422 )
8500 2035.5, 8700 1836.5(x2) gives us –1637.5
Then:
2180, 1980.5(x2) Gives us 1781 Brutal, but we ignore the pain.
Now 8500 2006, 8700 1806.5 x2, gives us 1607 We need to roll into August expiry but the 8500 strike does not exist, so we’ll take a view in the week ( we could go with other strikes of course)
Rolling on Thursday meant going lower to 8400/8600 which gave us 17450 against the cost of closing out 16520.5 = 930, running total of income 930+422 = 1352
Still a horror show but the plan is to illustrate the ‘sunk cost fallacy’. It’s always better to close out losing trades, but we can run things to our advantage some times. This is not one of those times!
Trade 471 A New Month -Seasonality?
Ask AI- https://www.ecosia.org/ai-chat?q=july+stock+market+performance
It seems when July takes a dump it’s of Elephantine proportions! But typically it’s an up month. Should we pay much attention to the past?
I like to think there’s a disaster around every corner, like all good dramas! Let’s buy a cheap handsome looking put spread and pay for it by selling a put further out. Those strikes and prices: buy the 10100 put, 45, sell the 10000 put 32.5 and sell the 9700 put for 14. Gives us a tiny credit 1.5. Most likely it will go to nothing and we lose nothing. But… it can make 100
This week: 10100 23, 10000 17, 9700 8.5, negative 2.5 Now we can do another lot, what’s the problem with that?
10100 6, 1000 4.5 9700 2.5 Well it’s all gone Pete Tong! We run to expiry with no loss.
Effectively ZERO. We run to expiry.
Expiry at 10543 trade goes out worthless but we LOSE nothing
Trade 472 The Trade A.I. Hates
https://www.cmegroup.com/tools-information/quikstrike/options-calculator.html
The above link takes you to the calculator like this: 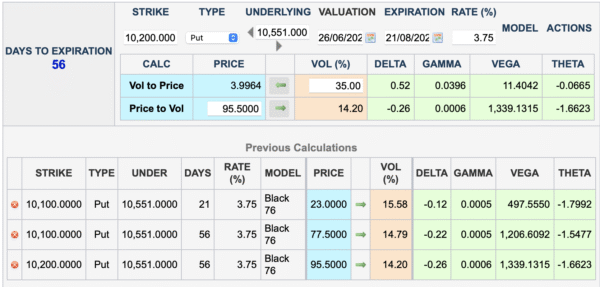
Put sellers have had it their own way as the dup buyers seem to have bottomless pockets, so let’s have some put risk. We are selling the July 10100 put, we are selling the August 10100 put and buying the August 10200 put. It’s a calendar spread but our far month has an extra short put. Credit 5. Let’s do the maths: Delta over all is +0.34 – 28= +0.08 almost neutral. Gamma almost neutral, Vega -near month more spicy as expected, but here’s Theta: 1.68 in our favour. Risk around 10000.
However let’s run a parallel trade- the diagonal which is low risk but you can lose a fair chunk of premium. A diagonal is: sell an option in the near month, buy one of a different strike in the next month, so here(10100 July, 10200 Aug) it costs 95.5-23= 72.5. Some people trade these very successfully but for me you are chasing the market for your money back. We’ll run both and collect £££ or adjust
July puts 10100 6 August 10200 52.5, 10100 42 credit 3.5
The Diagonal Cost 72.5 now 46.5 Ouch!
July 10100 put 3.5 August 10200 74.5 10100 58 Give us a credit 13
August 10200 put 53 and 10100 put 41 =12, credit 5 to open=17 WIN! ( the diagonal is a horror show which is why we show it but don’t do it). As usual DYOR.
Trade 473 Making Predictions
Especially about the future- not advisable.
However we are looking at a potential expiry of 10200-10600 according to my FTSE radar. We want safe, cheap and hopefully rewarding. We go with a wide call butterfly 10200 490.5, 10400 300 10600 133 Sell the body x2, and buy the wings. 490.5+133= 623.5, and the body that we sell 300×2, give us a very decent price of 23.5. This has max profit of 200 and max loss 23.5 It has a decent range in which we could be profitable. If it loses it costs nothing to abandon the whole thing, avoiding commissions.
Now the prices give us 313.5, 132 x2, 22.5 = 72- 23.5= 48.5 PROFIT 100% We’d take that, but we run to expiry for the big bucks.
Cost 23.5 Expiry 10543. So, 10200 343, 10400 143×2, 10600 0. Gives us: 57 > 100% profit WIN!
Trade474 August Cycle Coin Toss
It’s that time again when we want to try our luck in a short term gamma play. As we approach expiry the gamma (rate of change of Delta, explodes in the expiring series, relative to the next month). So we sell the August straddle and buy 3 July straddles,( in a sort of suicide pact! ) Now if the July expiry is at 10500 we are toast, if we’re at least 150 away from that in either direction we could have a nice win. So here’s how the numbers stack up. July 10500 straddle 62 and 54.5( call and put), dirt cheap! August straddle 156.5 and 164.5. So we have 321 and 116.5×3 = 349.5. Cost 28.5 This can win by a big move or a bigger increase in volatility in near monthly relative to the far month. I’m not optimistic, so we will turn this on its head.
We BUY the August straddle and sell 3 July straddles and bet on a 10500 expiry. It is a bet, as adjustment will be tricky.
As expected the market failed to deliver the monster volatility this needed. So how did it perform? It lost. Monday it lost 28.5-16= 12.5 that was the best we could do. Tuesday? 28.5 +18 loss Wednesday 28.5+92 loss Thursday 28.5+98 loss Expiry 10543 gave us 28.5+162 loss. LOSER
It’s worth taking time out here to analyse what can be great trade WHEN the conditions are right. It’s also gained my attention as a possible strategy selling the near month x3, assuming the far mont straddle is worth at least 300. Even then, if it’s possible to get a decent showing with selling only 2 near month straddles, the expiry week may well show a very good rate of flatlining. This we can exploit. I’ll ask AI!
Trade 475 New Expiry Cycle
A wide bodied butterfly of puts – why not? We fancy having a wide profit area in our August trade long 10600 put 165.5, short x3 10300 put 69.5, long x2 10150 put 46.5. Gives us a net cost of 50 with the trade in profit down to 10200-ish. We’re toast if the buying frenzy carries on, so can we mitigate costs? Let’s sell a 10100 put for 41. Now our cost is reduced but we have risk <10100 Our risk is limited to 9 to the upside. So we don’t mind losing 9 to be rewarded up to 300. It would be nice to say X+Y=Z where Z is the expected market range with a bias to the downside. but we have zero guidance currently. Hand on heart, this is highly speculative. You could just sell a 10100 put! (Don’t be THAT guy )
Glossary:
There are two types of options: Puts, give you the right but not the obligation to sell the underlying asset . Calls give you the right, but not the obligation to buy the underlying asset.
When you sell those options, the opposite happens, with puts you get stock ‘put‘ to you at an unfavourable price (or not) and calls you get the stock you own taken, or ‘called’ away. If you don’t own the stock you need to stump up the cash, but in both cases with the FTSE index they are cash settled at £10 a point, so losses and gains are uncomplicated.
Please read the links below for a more comprehensive explanation in simple terms. Options are about mindset, only a modicum of intelligence required.(I’m living proof)
For those new to options:
https://optionsinvesting.co.uk/special-edition-how-options-work-1/
https://optionsinvesting.co.uk/special-edition-how-options-work-2/
https://optionsinvesting.co.uk/how-options-work-page-3/
Contact: surreyhantstraders@gmail.com.
If there is anything you’d like help with, we all started somewhere and yes, it can be baffling. There are no stupid questions, give it a whirl. (AI gets things wrong, remember)
All opinions expressed here are not to be taken too seriously and all of the trades are for educational purposes only.