That Was The Week Meltup 99 Happened
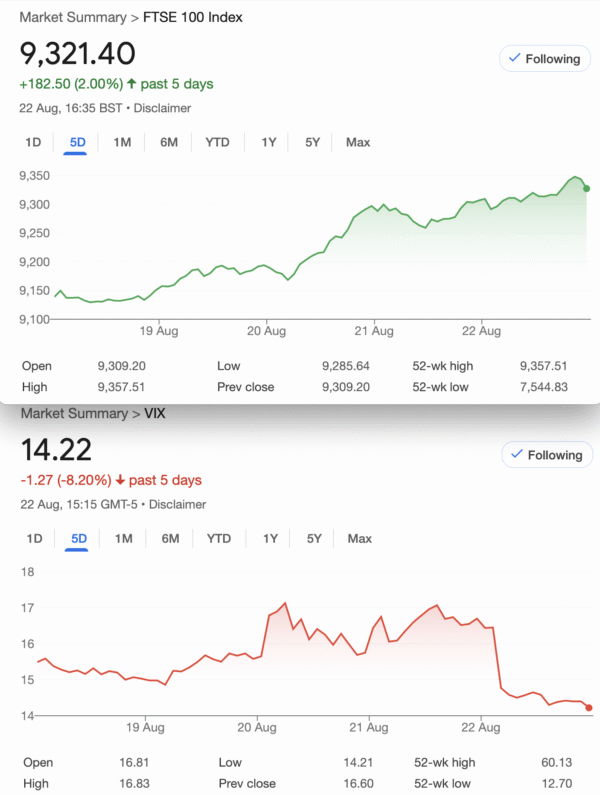
So, since the Trump Dump in April which was surely a premeditated piece of nonsense, we have had 14 UP weeks and 2 DOWN. This year by my reckoning we have had 98 UP days 62 Down. It may mean nothing but historically we get a more balanced outcome as buyers and sellers put their money where their mouth is in equal measure plus 1-2% for ups. I’m not alone: 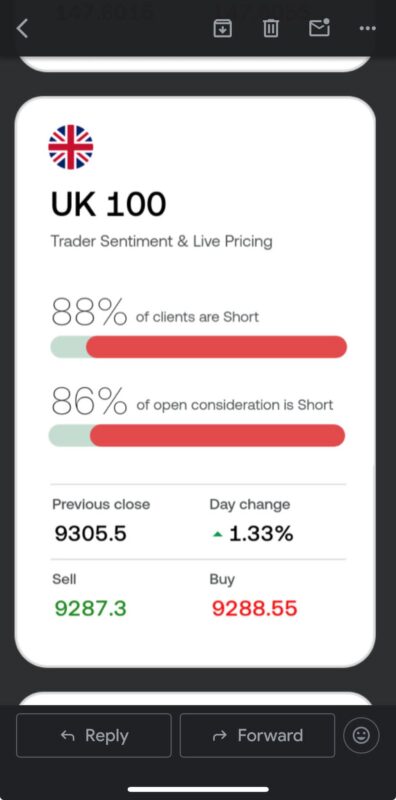
So, can anyone explain what the heck is going on? There are as always people talking up the FTSE and extolling its virtues, they like to sell things. The doom mongers(like me!) subscribe to the ‘misery loves company’ brigade. We’re cynical not because we’re miserable old wotsits but because our market experience tells us to be wary of ‘irrational exuberance’. However we are now in a world of s*d the valuations, look at the momentum, FOMO beats risk aversion.We offer no market forecast, we have our specific brief of educating by showing a trade every week, based on real prices.
In The Inbox
Buckle up, strap in, grab a pen and immerse yourself in the many facets of trading https://www.youtube.com/@festivaloftraders/videos
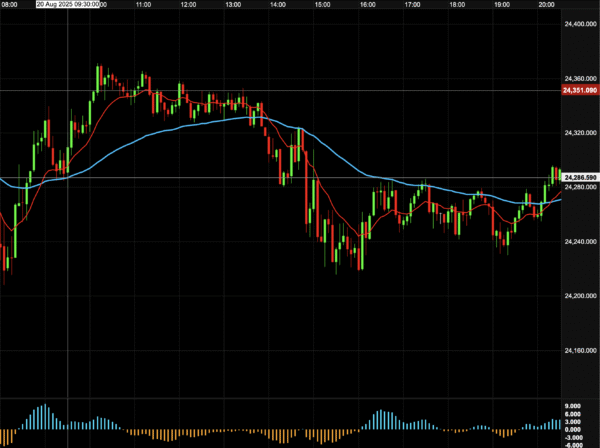
While much of it seems ‘esoteric’ Ichimoku is interesting and as a member of Society of Technical Analysts many years ago, it was ably demonstrated to me as a useful tool. However the interpretation, like any indicator is subjective. Candlesticks were invented for use in the Japanese rice market and for that we are eternally grateful. I may be a terrible trader, but I like candlestick charts, as per our DAX trades:
Distraction Trades
ADA was $0.9110 now $0.9132 ( a high of $1 recently)
XRP was $3.1117 now $3.0346 Some spicy action for our chosen Cryptos yet again.
DAX : 2 days no trades, 1 loser 2 wins nett:110 It’s got weird
UK Gilts Were £15.82 now £15.75 This is based on the Vanguard ETF, not a lot of love, though of course price goes down, yield goes up. Hard to know if Gilts are worth having. The ‘Risk On’ brigade might see a pretty decent return as the 30yr Gilt is yielding North of 5.5% and decide to dump the stupidly over priced stocks.
Legacy Trades -Mixed/Losses plus new trade 428
Trade 424 High Risk Big Reward
We will roll Trade 415/415b but also instigate a new trade which is long August 8450call short 2 x 8650 call. Those prices: 531 and 342, so as a new trade there’s a CREDIT of 684-531= 153. As a legacy trade there is a small credit 34.5. This as you can see, is deep in the money with risk at 8850 This may be a struggle but what if we can roll, for a credit ad infinitum?
Was 8450 call 652 8650 calls 456.5 x2 Gives us: 913-653= minus 260 We are running this, remember but it’s not pretty right now!
Was August 8450 call 600 8650 call 405.5 =minus 211. Still underwater with both trades but remember we are rolling, as and when it’s optimal.
This week: 8450 call 618 8650 call 419.5 = 221 Worse, and maybe more misery to come, but….. we can roll, and that is what we’re doing, remember
LOSER! However we are rolling this to show how things can get uglier/ possibly better. How and when to roll? Don’t leave it to expiry, we did this on Thursday:
August: 8450 call 718 8650 call 518 rolled to Sept: 8450 call 759, 8650 call 564.5. We pay 41 for the 8450 roll, but collect 46.5×2 for the 8650, which give us: 42
As legal trade this has now given us 34.5+ 42= 76.5, as new trade 153+42 =195. (Bear this in mind as it will come right sometime!)
Previous position: 8450 727.5 8650 534×2 = 340.5 Losing more!
Oh dear oh dear: Now, 8450call 905, 8650calls 707.5 x2 gives us: 510 LOSS
Remember we are running this and against the current market frenzy it will get ugly, but let’s see if this can come right.We can run, AND we can hide!
Trade 428, A Dog’s Breakfast of puts
Well as there is no downside risk whatsoever, we’ll take a bucket load of puts and sell them. We’ll buy a few too.
A quirky put ladder starts with a long 9200 put, 115, short 8950 puts x3, 41=123, long 8850 put, 29×2,=58 short 8600 put x2, 15=30. Debit 20
We have risk at 8600 but that seems as likely as the Loch Ness monster standing for Parliament (Quote me!) Max profit 250-20 =230
Here’s the risk graph: https://optioncreator.com/styasba
Now: 9200 put 39, 8950 puts 15×3 8850 puts 12×2, 8600 puts 7×2 Gives us 4, this is terrible!
Trade 429 Raging Against the Machine
Maybe we get a dip, maybe the Moon is made of cheese. We find a trade that has moderate risk, generally and so we are again going with puts in a calendar ratio spread. Calendar: We sell a Sept 9150 put, 31, sell an October 9150 put, 65.We BUY an October 6250 put,90.5. This gives us 90.5 minus 65+31= Credit 5.5
For those new to options:
https://optionsinvesting.co.uk/special-edition-how-options-work-1/
https://optionsinvesting.co.uk/special-edition-how-options-work-2/
https://optionsinvesting.co.uk/how-options-work-page-3/
Contact: surreyhantstraders@gmail.com.
If there is anything you’d like help with, we all started somewhere and yes, it can be baffling. There are no stupid questions
All opinions expressed here are not to be taken too seriously and all of the trades are for educational purposes only.